Deputy Superintendent, Westminster School District
Gerardo Martinez
Executive Director of Educational Technology, Westminster School District
KARST02 / 14
Why I did this
Eight weeks ago, my son arrived.
Before he came, I handed off everything a helper could carry, so my time could go to people.
KARST03 / 14
The master agent
One agent runs the week. You keep the yes.
It checks my mail, calendar, shared drive and recordings on a schedule, hands each piece to the right helper, and brings the work back ready for me. Anything that leaves my desk waits for my yes.
Work movingWaits for your yesApproved, goes outMy own setup
KARST04 / 14
The human outcome
The work is not the app. It is the better day someone has because it exists.
Less friction for staff. Clearer insight for leaders. Better days for students.
KARST05 / 14
Microsoft Work Trend Index, 2023
Where the week actually goes.
In 2023, Microsoft measured how people spent their time in its work apps, and asked 31,000 workers in 31 markets how their days felt.
Microsoft Work Trend Index, 2023
Where the time went in Microsoft's work apps
Communicating: meetings, email and chat57%
57%
What it says
57% of the average employee's time in Microsoft 365 apps went to communicating, in meetings, email and chat. The other 43% went to creating.
Doubling about every 4 months since 2023; about 12 hours in February 2026. Time Horizon 1.1: a doubling time of 131 days since 2023, and 196 days (about 7 months) over the whole record from 2019.
How it is calculated
The solid line and its dots are read from the document. The dashed lines are not data. Each starts at the February 2026 point, about 12 hours, and doubles at one of METR's two paces through April 2028: every 131 days (about 4.3 months), its pace since 2023, and every 196 days (about 7 months), its pace since 2019. The shaded band lies between them. The headline's “about 4 months” is the 131 days, rounded.
Where the dashed lines land
At the recent pace: 40 hours (a work week) by Sept. 2026, 170 hours (a month of work: 40 hours a week for about 4.3 weeks) by June 2027, and about 770 hours by April 2028, above the top of the chart. At the long-run pace: 40 hours by Jan. 2027 and 170 hours by Feb. 2028.
Easy to misread
Mostly software tasks, measured in a skilled person's time, at 50% success. Points before February 2026 are approximate. METR says measurements above 16 hours are unreliable. A test, not a whole job. The projection only shows what happens if the pace holds; past trends may not continue. METR notes the trend is somewhat sensitive to which tasks are in its suite and that its confidence intervals are still very wide.
is how often the length of task the newest systems can finish on their own has doubled since 2023.
Recent pace: doubles every 4.3 monthsLong-run pace: every 7 months
Source: METR, updated Sept. 8, 2026. Dashed lines: a projection, not data. Press the info mark for the full receipt.
KARST08 / 14
Why change is slow
Districts are built to be predictable. That is the point.
“Everyone’s comfortable. They show up in the morning, everything’s predictable.”
Eric Schmidt
Former CEO of Google. In Good Company podcast, “Eric Schmidt: Are We Ready for Superintelligence?”, Oct. 2026, at 13:22.
10 / 21KARST09 / 14
An everyday task: a walkthrough
A made-up example on a pretend computer. The people, rooms and sites are not real, and nothing leaves this page.
KARST10 / 14
Rich's system, my build
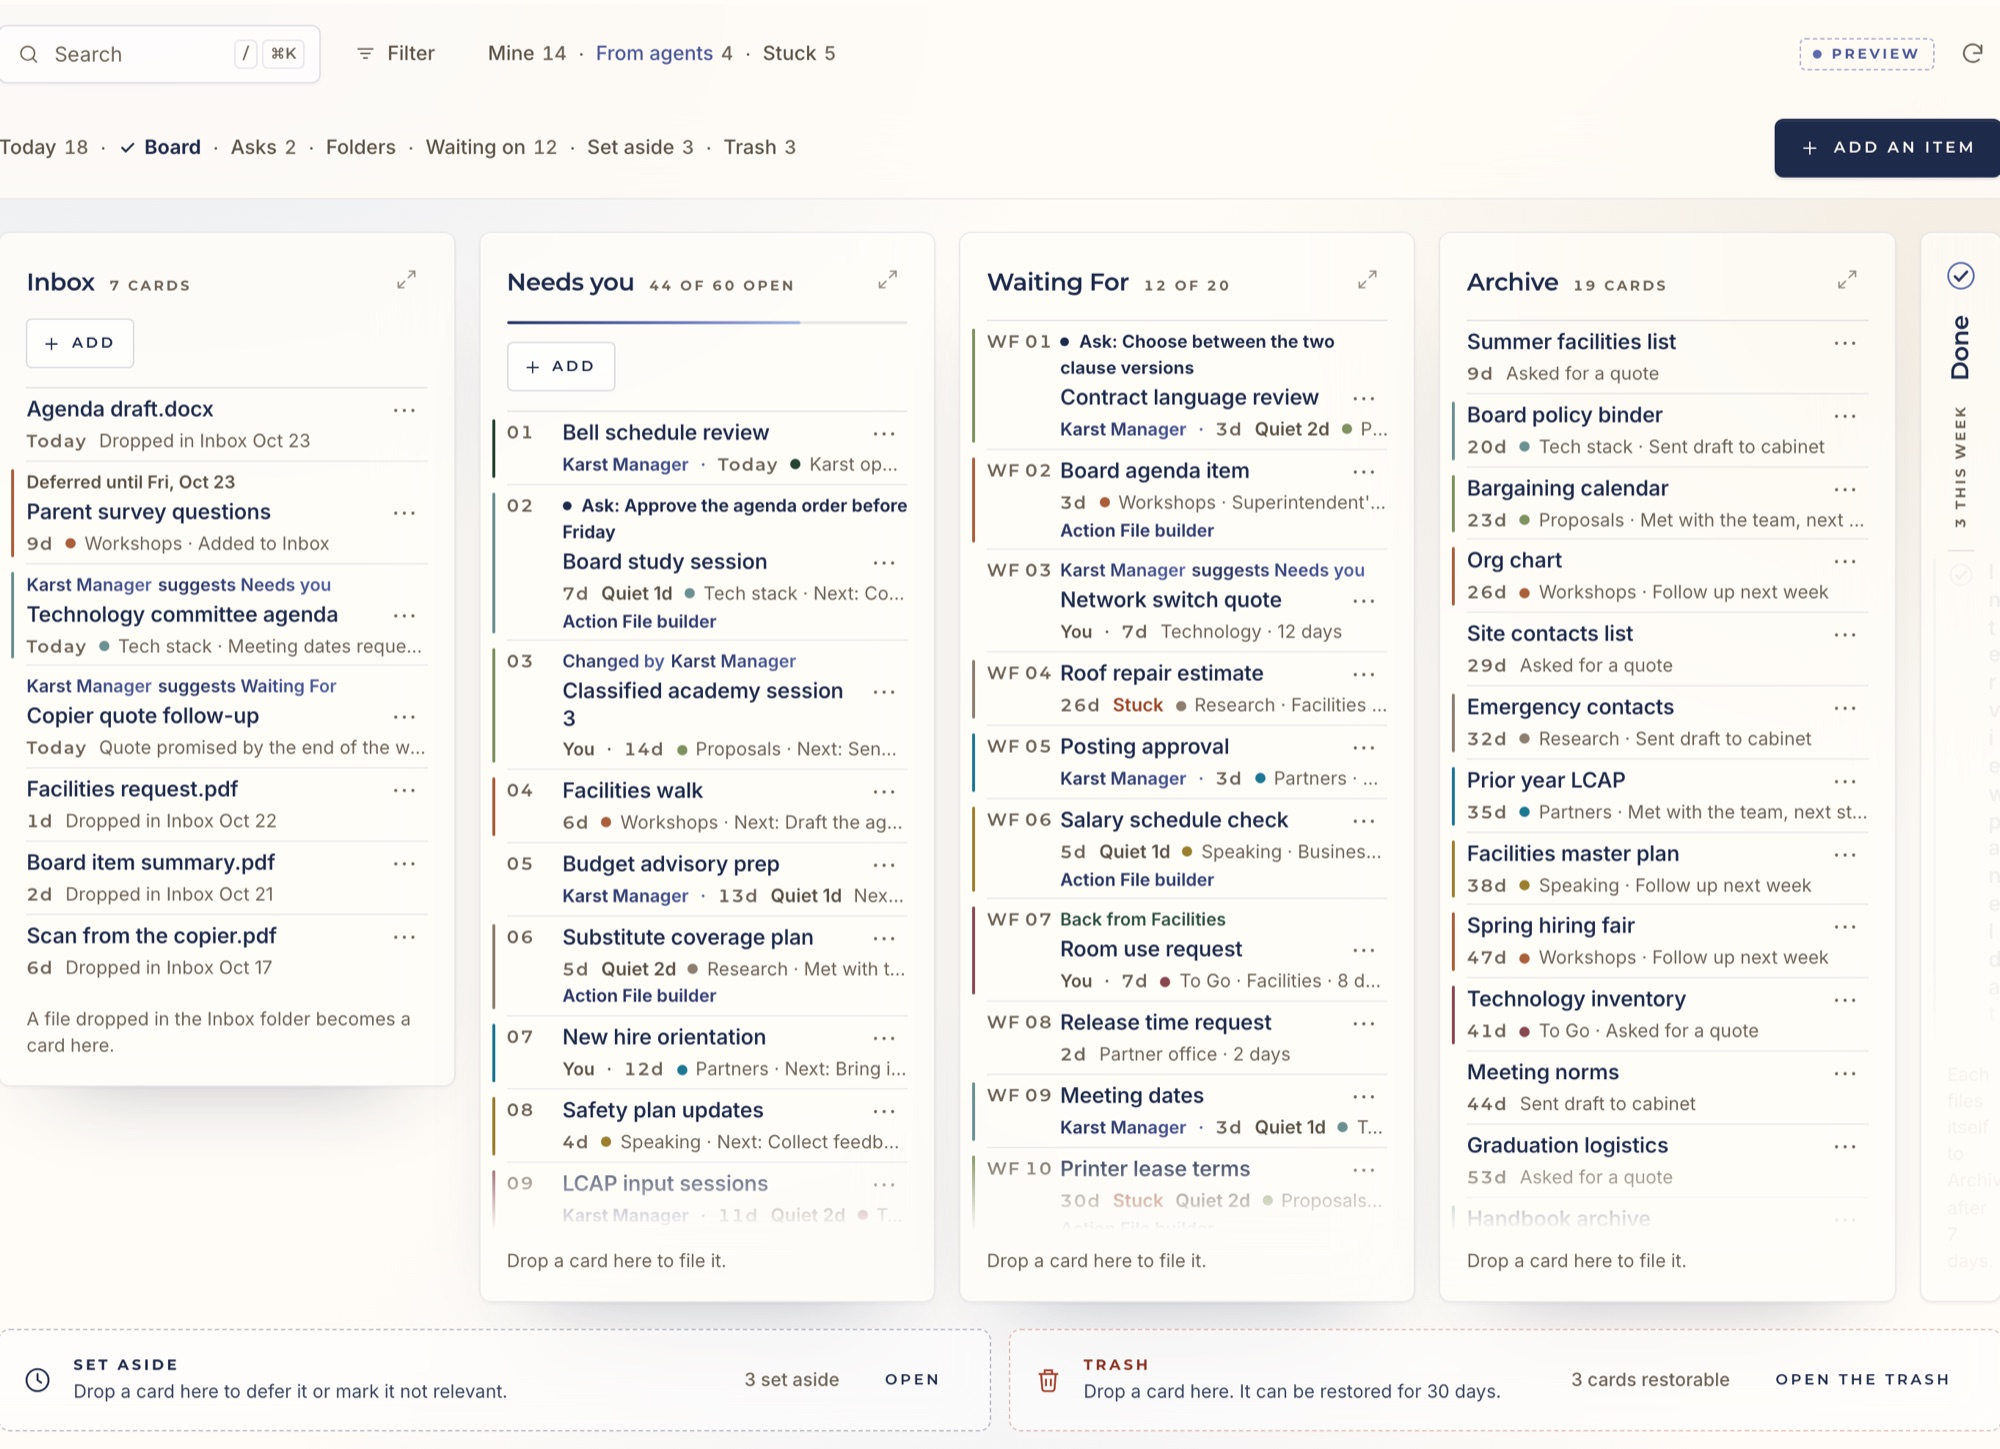
Twenty-five years of paper files. Now a board.
The paper file
A
Action
Up to 60 open projects. Each one has a Project Index sheet.
R
Reference
Kept on hand to look things up.
A
Archival
Finished, and filed.
T
Trash
Let go.
Sample · My board
Sample cards. The helpers suggest; a person decides. It never sends, shares or spends on its own.
KARST11 / 14
Westminster School District
A year of team cycles, read in one place.
Open live ↗Presented on the panel by Westminster's own leaders.
KARST12 / 14
Roseville · The LCAP walkthrough
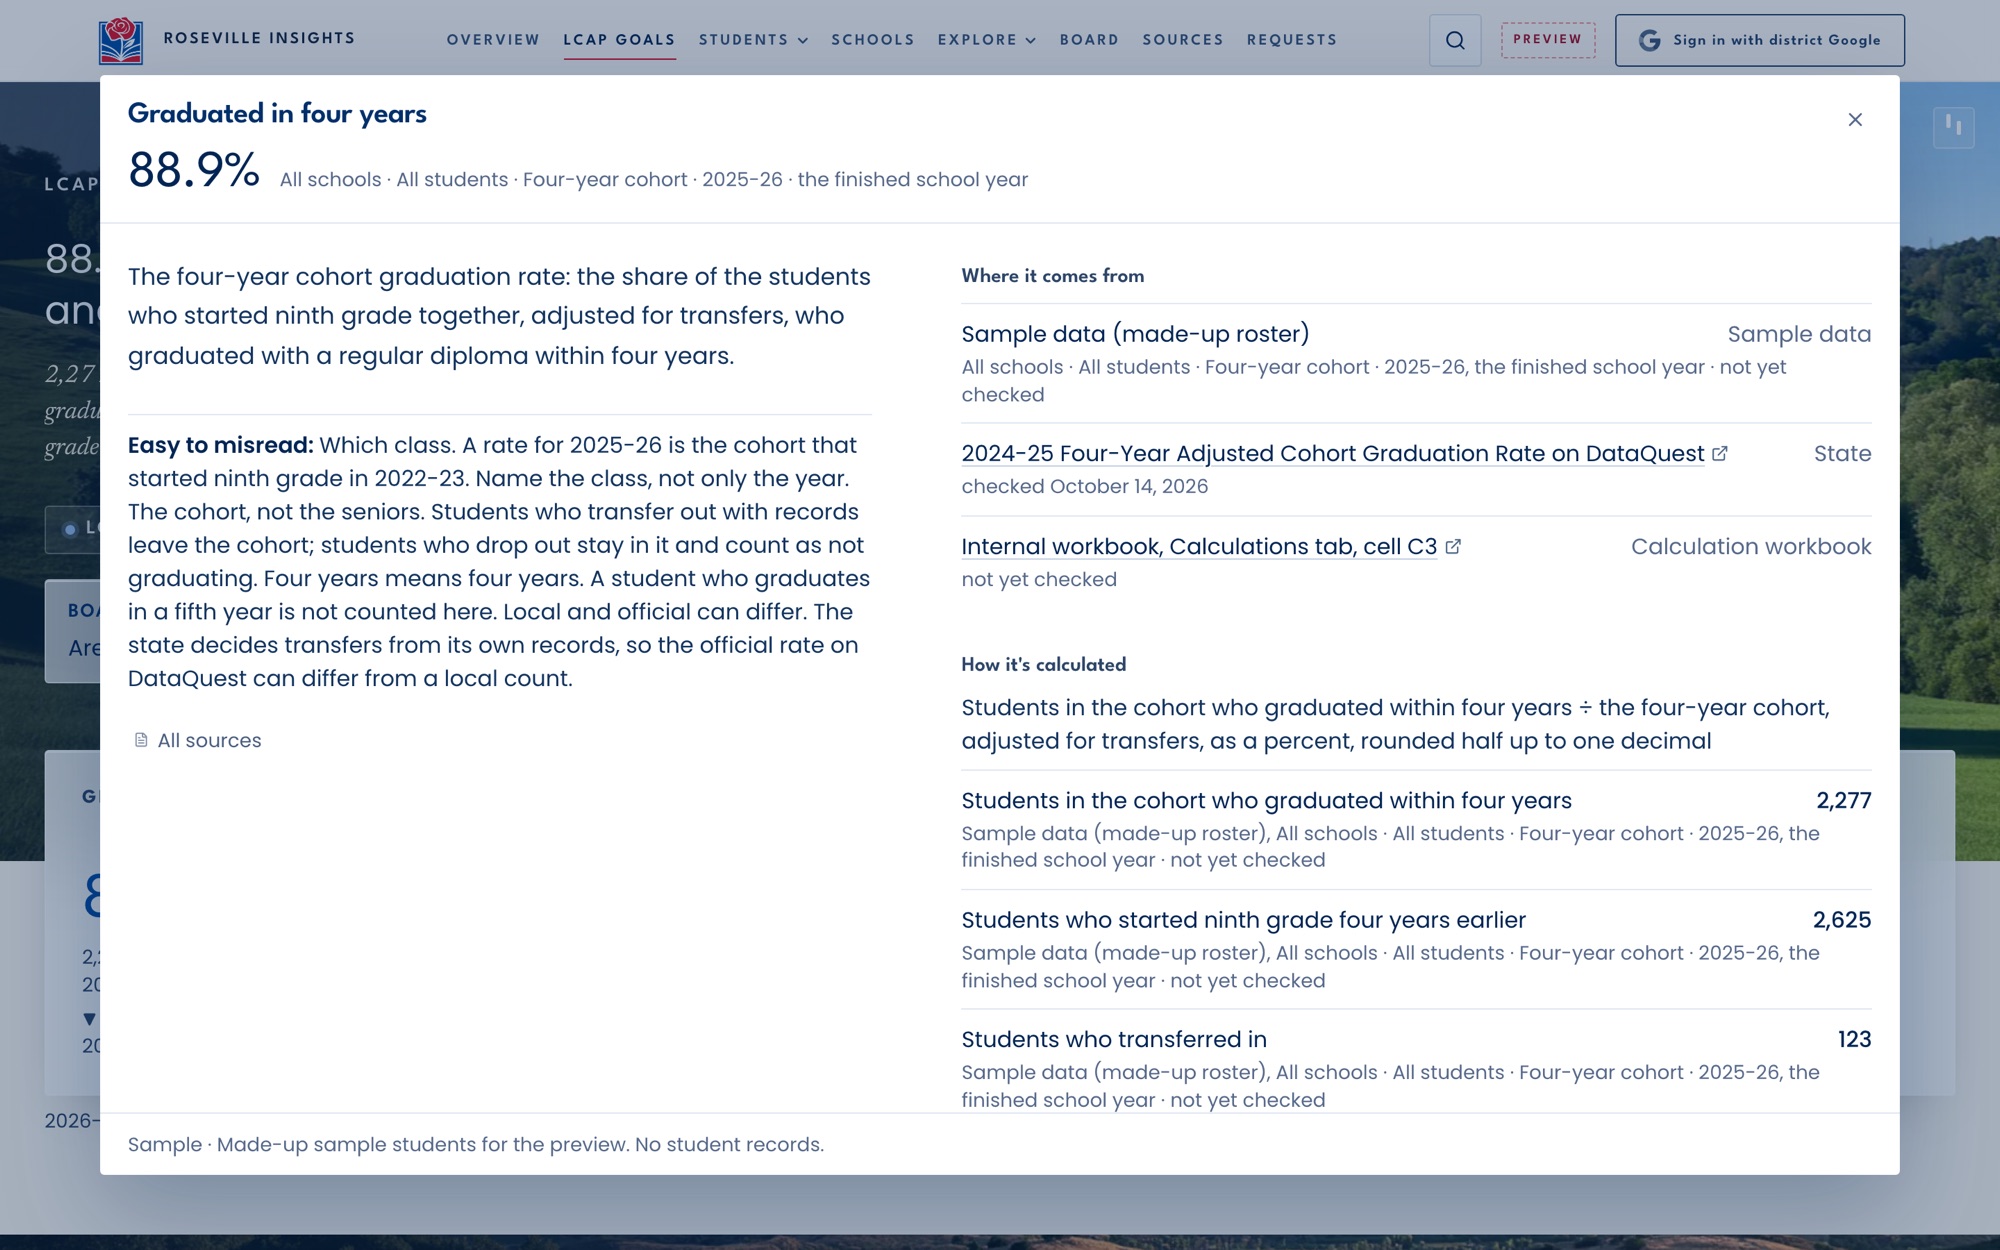
Every number has a receipt.
Tap a number. The panel opens: what it means, where it comes from, and how it is calculated.
If a number cannot be traced, it does not go on the screen.
Sample
Open live ↗Sample data. Made-up students, no student records.
KARST15 / 21
Twin Rivers · Vision 2035
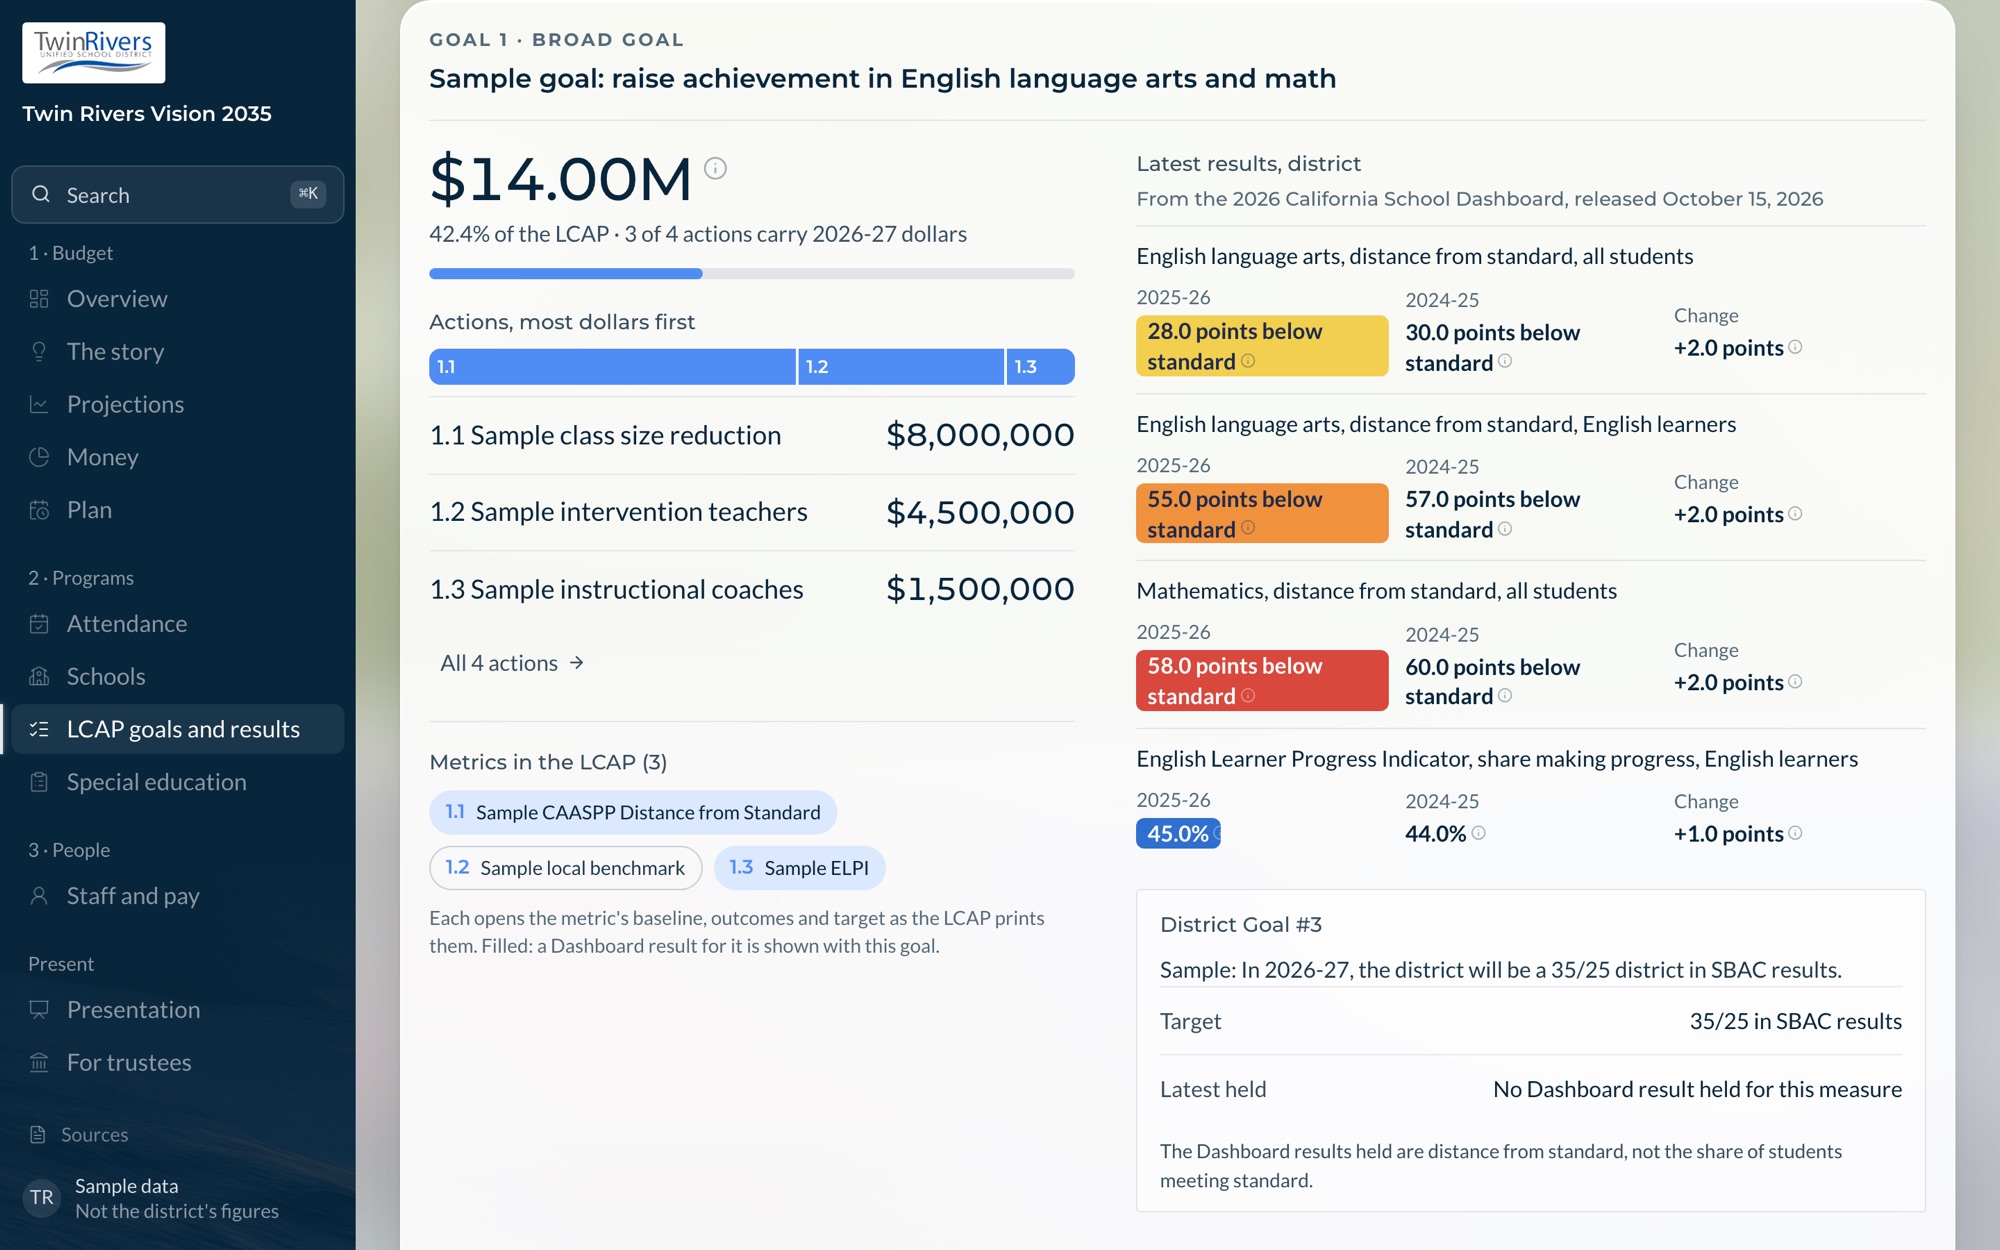
Budget, programs, people. In one book.
Three chapters: the budget, the programs, the people. Each LCAP goal shows its dollars, its actions and its results against the target.
Every figure opens its source.
Sample
Open live ↗Sample data made up for the preview, not the district's figures.
KARST16 / 21
Two department explorers
A department, seen whole.
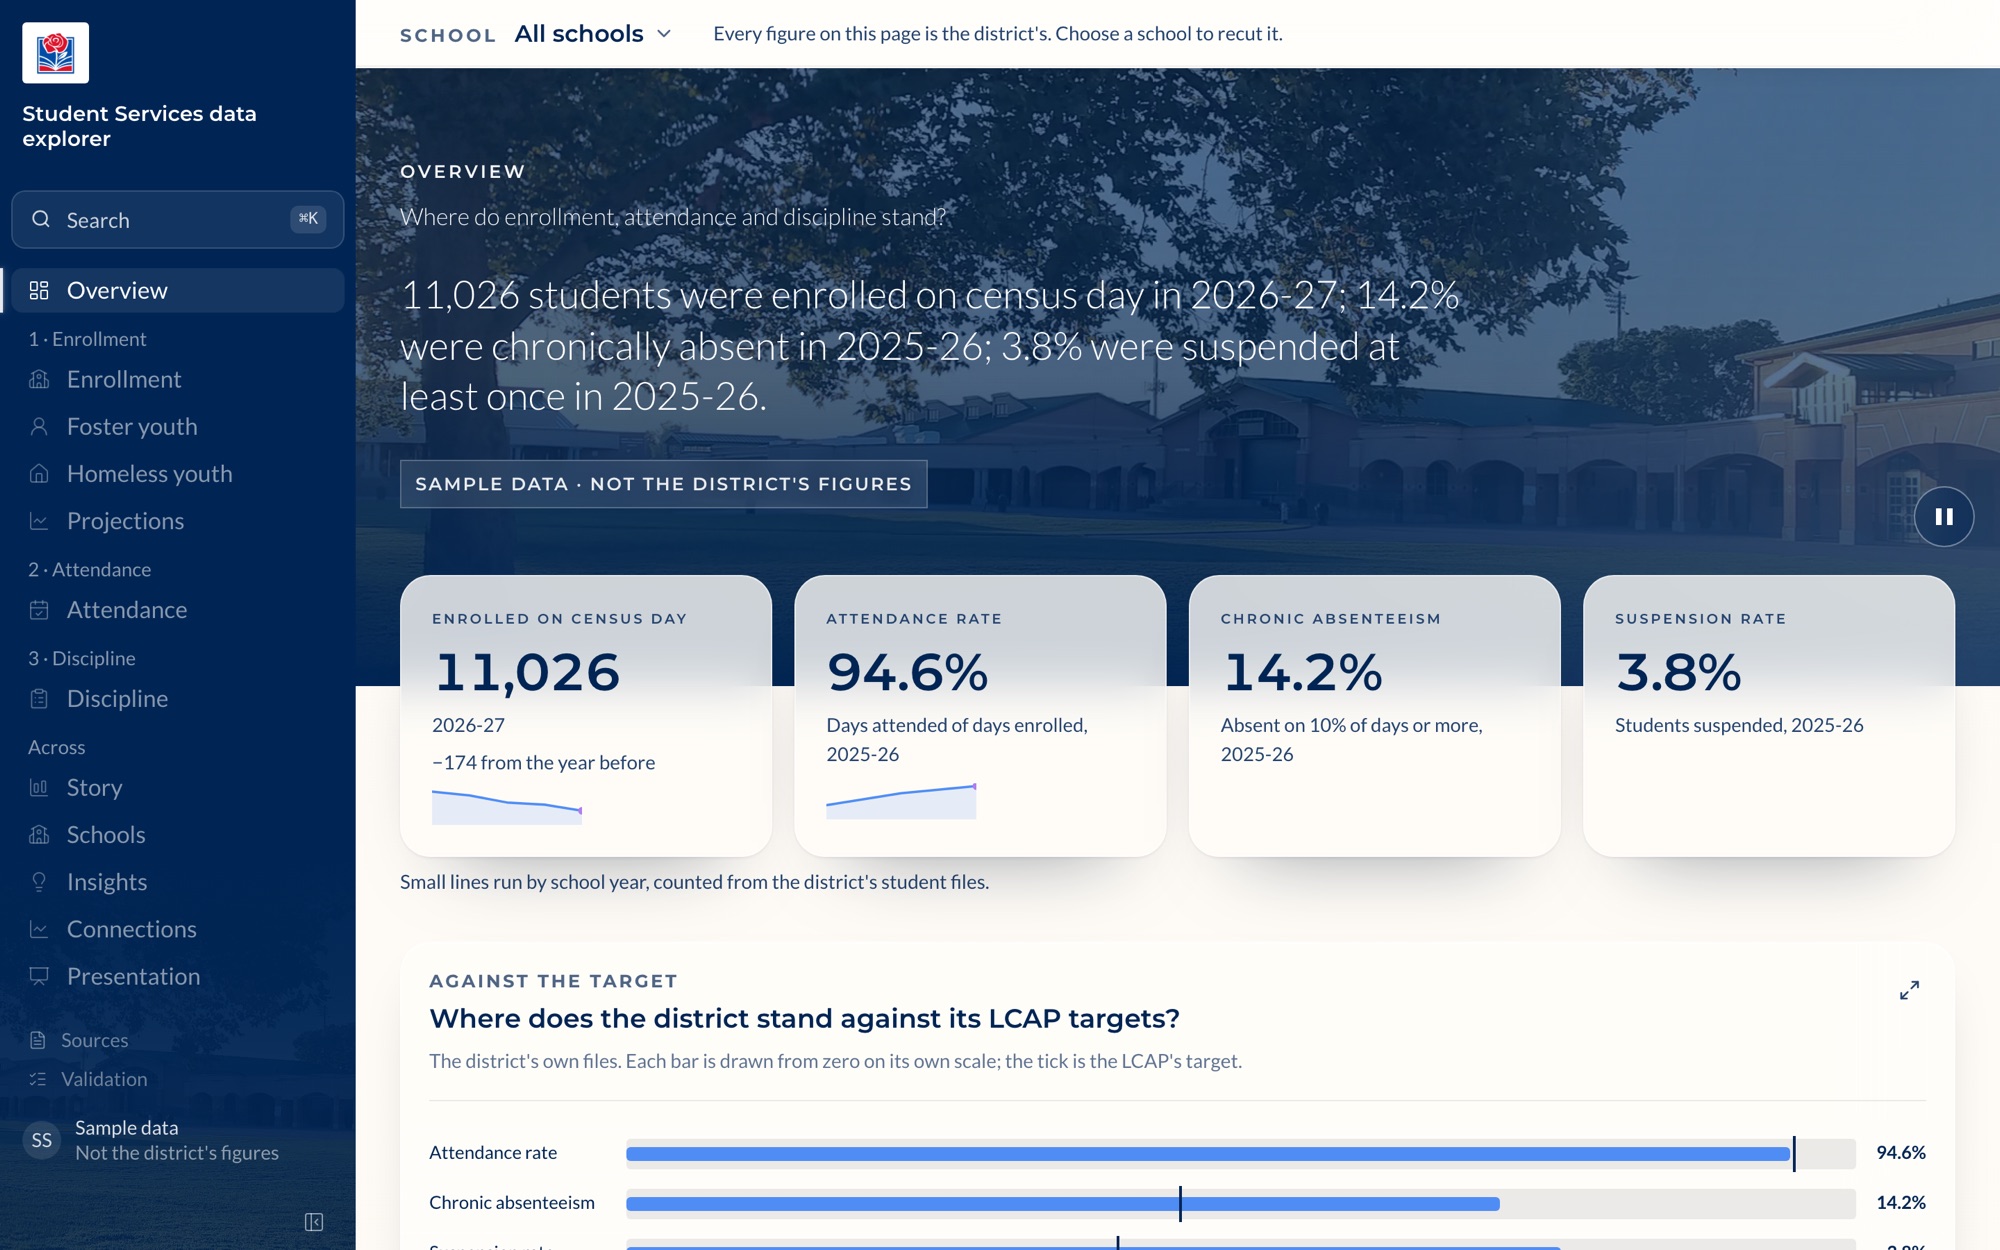
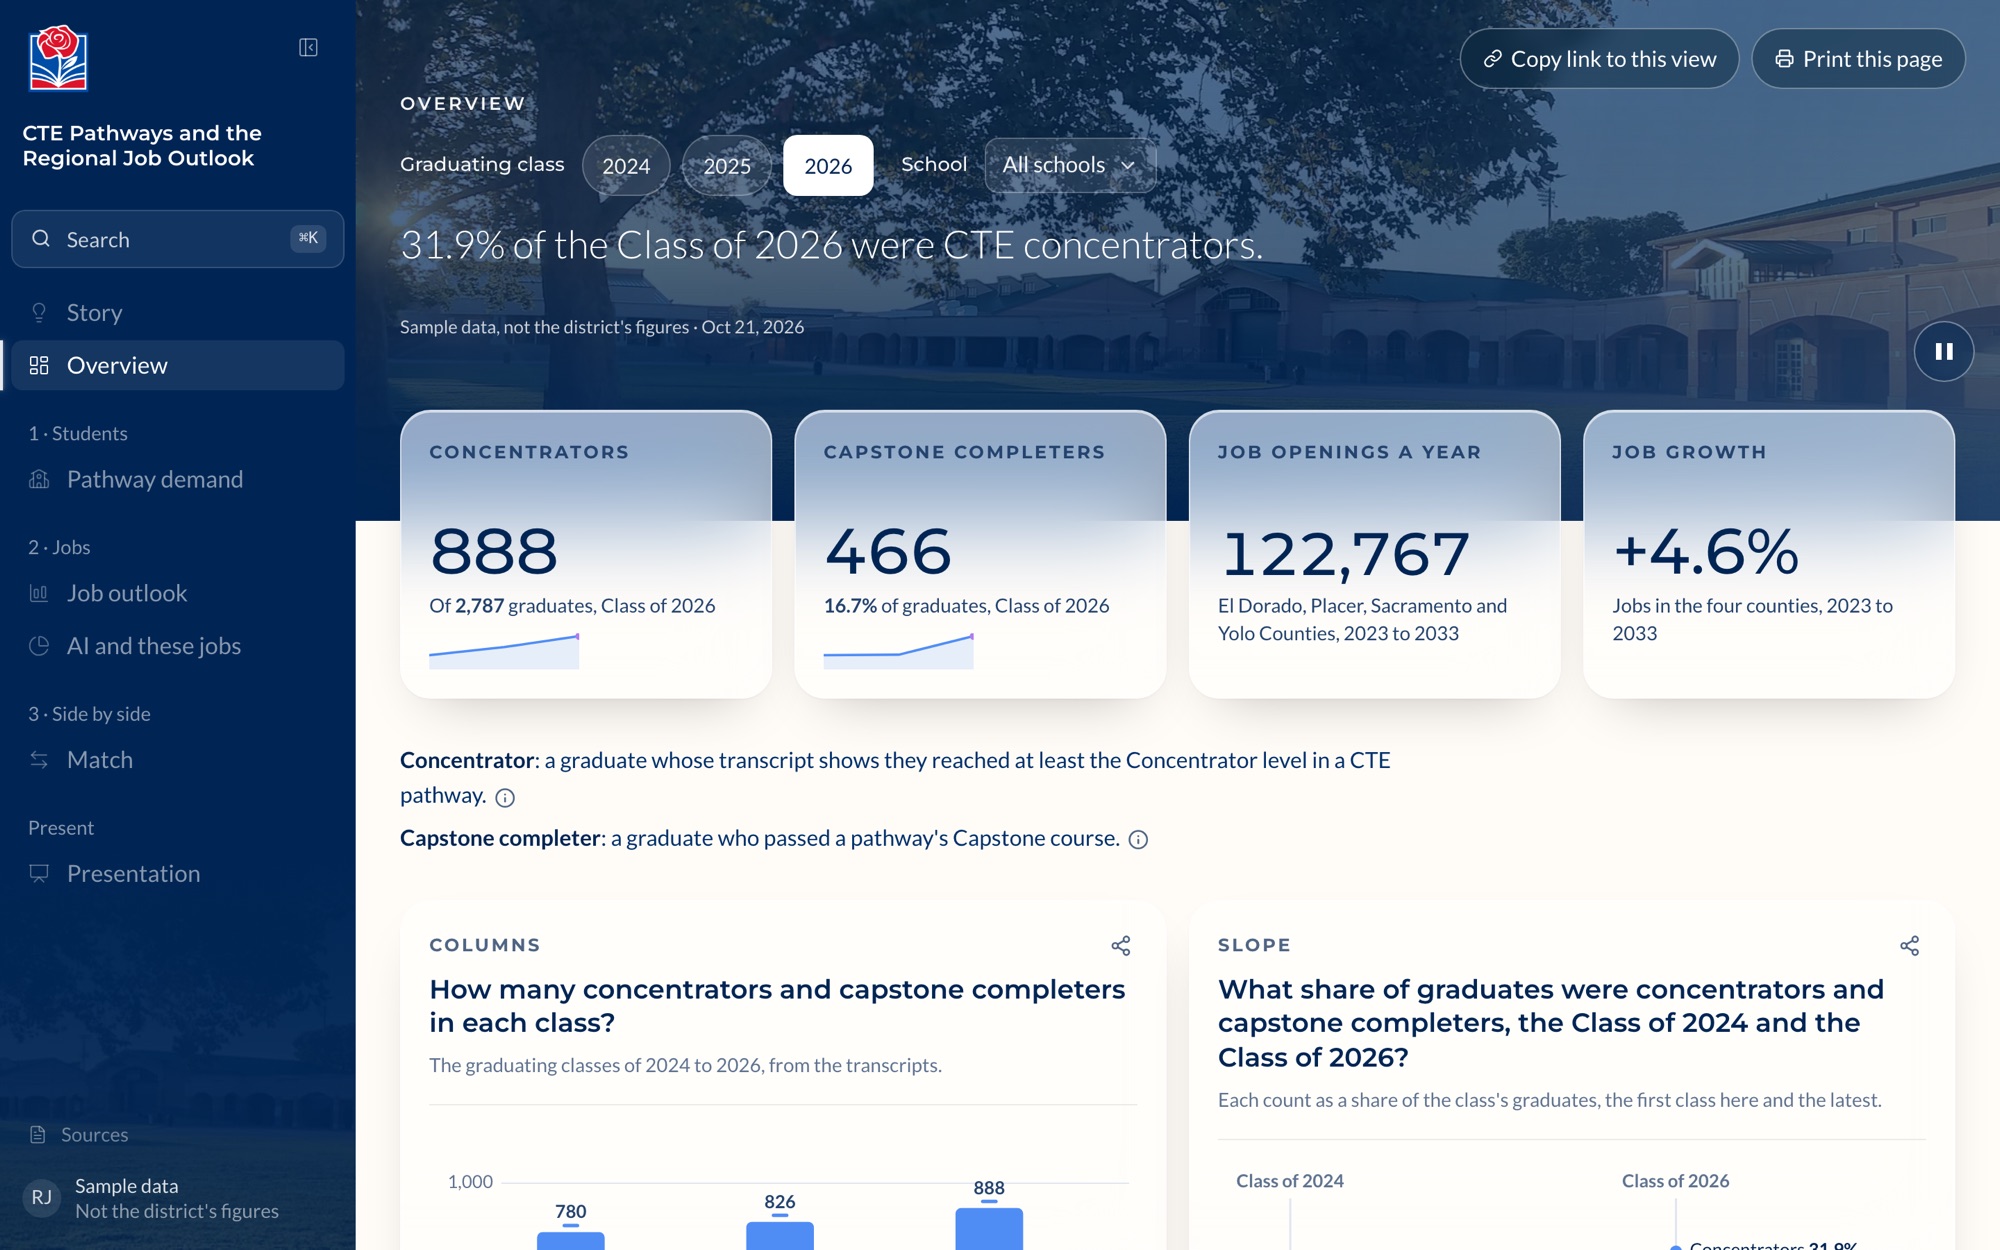
Enrollment, attendance and discipline in one explorer. CTE pathways beside the regional job outlook in another.
Sample · Student Services
Open live ↗Sample data, not the district's figures.
Sample · CTE Pathways
Open live ↗Sample data, not the district's figures.
KARST17 / 21
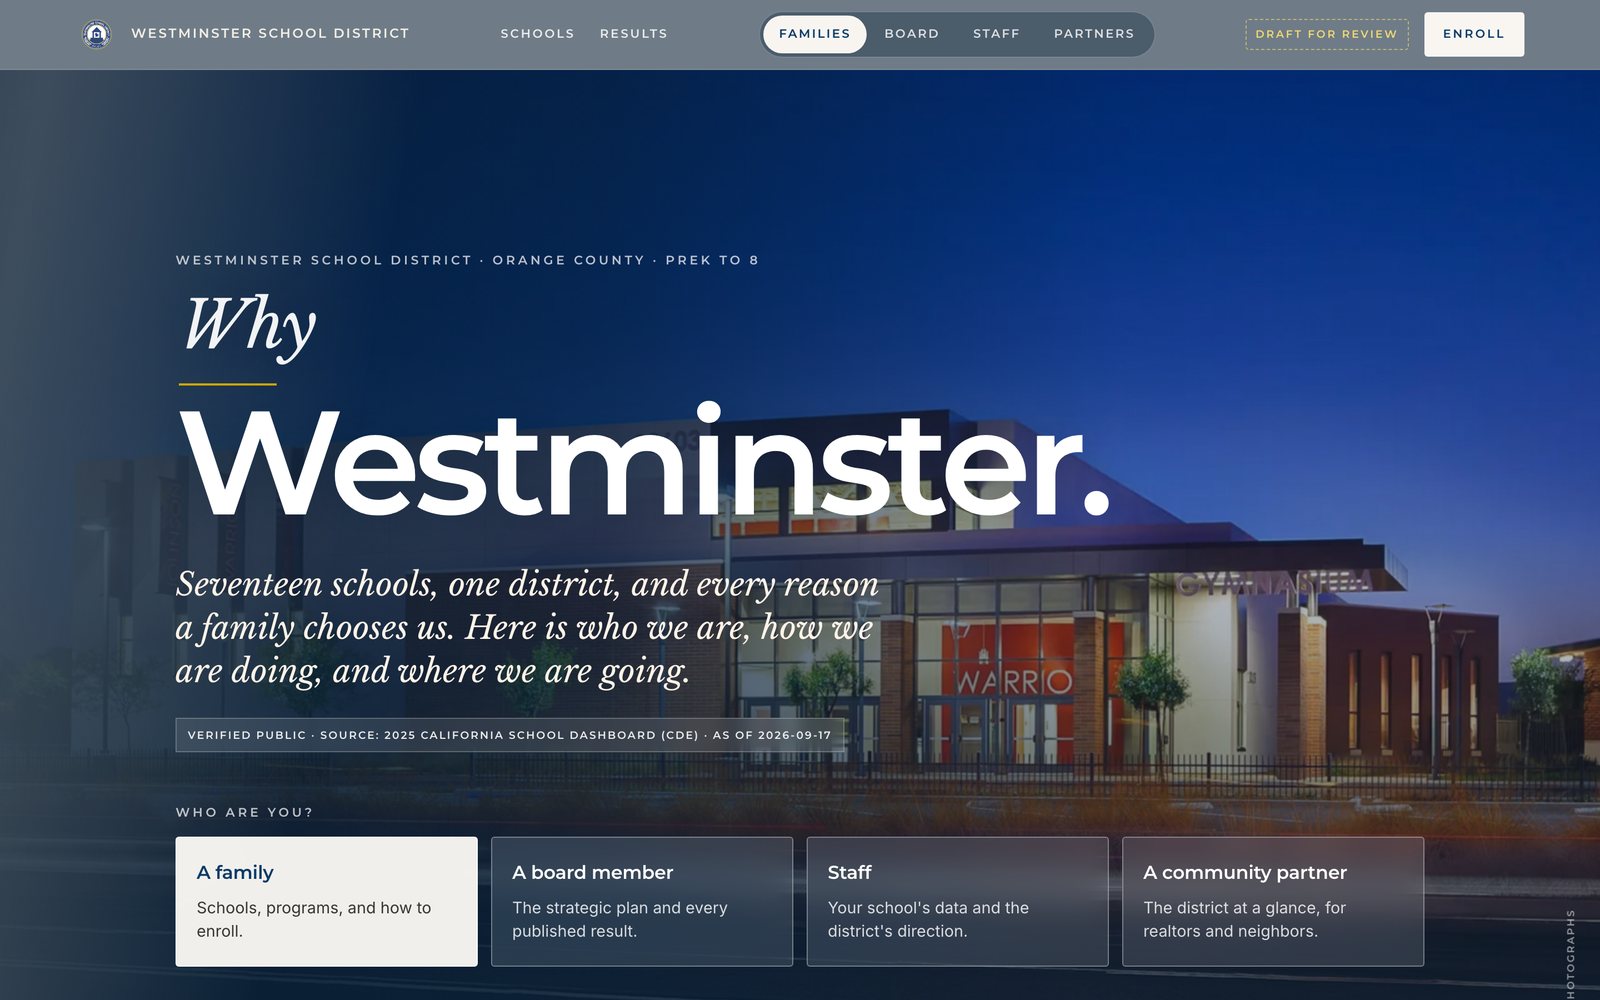
Westminster School District · Why Westminster
From insight to the story families read.
With enrollment falling, a district makes its case to families. The helpers connect the data, then draft the plan.
What a family gets: seventeen schools, one district, and the reasons families choose it.
Open live ↗Westminster's own page, a draft for the district's review.
KARST18 / 21
For every district
Most districts don't have a builder. They shouldn't need one.
Start with your team
The same systems, set up for your district, at your pace.
Executive team session
One department's data
A board for each leader
A kit for staff who build
Find me after →
KARST13 / 14
Westminster · The i4 Innovator idea
Staff will build their own tools.
Inspire, Innovate, Implement, Impact. Staff build on the district's kit, and every app takes the same route to a yes.
A clear route is what lets leaders say yes.
KARST20 / 21
Rich Montgomery · Deputy Superintendent, Westminster School District
Who gets the time back, and what do they do with it?
To close
The question is yours now.
One step this month: write down one weekly task, and who decides.
karst.build
KARST14 / 14
← → / space to advance · P for notes · B for black